Pingplotter cloud changelog
Содержание:
- Creating a named setting (configuration) to use a remote agent.
- Using PingPlotter Insights
- Licensing
- Configuring the Windows agent
- Gettin’ ping-y with it
- Installing the UNIX Agent
- Mac
- Comments
- Navigation
- Installing the Windows Agent
- Windows Agent Revision History
- Troubleshooting a remote network
- Essentials
- 03-01-2021 — PingPlotter Version 5.19.1 Update
- How Does PingPlotter Cloud Work?
- What to look for
- What to target
- Version 5 Manual
- Timeline Graphs
- Loading a list of targets
Creating a named setting (configuration) to use a remote agent.
Named configurations are covered in more depth in the named configuration section.
- Go back to the options dialog (Edit -> Options).
- Create a new configuration (Right-click on the «Default Settings» in the tree view and select «New Configuration»).
- In the newly created configuration, change the name in the main section (e.g., «via <your server name>»).
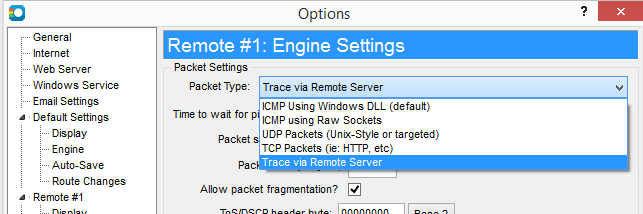
- Go to the «Engine» section of this new configuration and select «Trace via Remote Server» from the dropdown.
- In the new section «Remote Server Source Settings», Enter the URL to the trace agent there. For a Windows based agent, the URL will look like this: http://yourservername:7465/. For a UNIX-based server, the URL will look something like this: http://yourservername/script_path/trace.pl (or trace.php, if you’re using the php version).
Hit «OK» to close the options dialog and save your settings.
Configuring packet types via URL
You can direct the remote agent to use TCP or UDP packet types by adding specific parameters to the agent URL.
Under Edit → Options, select the Engine configuration you created for your remote agent. In the URL field, where you specify your agent’s IP and port, enter the following URL (be sure to replace yourserver:7465 with the IP and port for your specific agent):
- For TCP (Windows-only):
http://yourserver:7465/?PacketType=TCP&TCPPort=443 - For UDP (macOS-only):
http://yourserver:7465/?PacketType=UDP&UDPPort=33434-33625
Using PingPlotter Insights
Getting started with PingPlotter Insights is as easy as can be.
Currently, the Insights beta is available to all active PingPlotter Cloud users. There’s no sign-up or setting required to access the feature — Insights is already enabled for everyone.
To begin, simply open the Target View for a trace (this includes paused traces and older sessions). In the upper-right corner, you will now find a button to launch Insights.
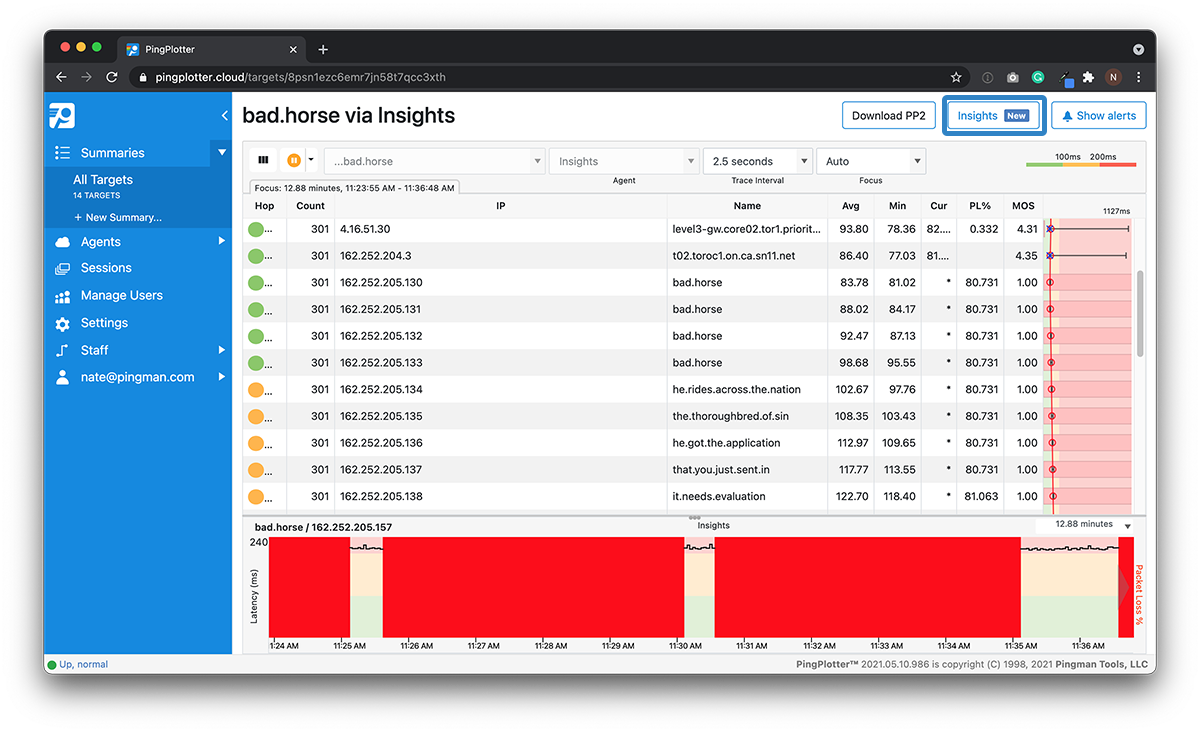
Insights will analyze the collected data for the current trace and identify when and where PingPlotter recorded potential issues.
Insights will then highlight any potential incidents on the Timeline Graph with a purple focus indicator. Click on the indicator to inspect the incident.
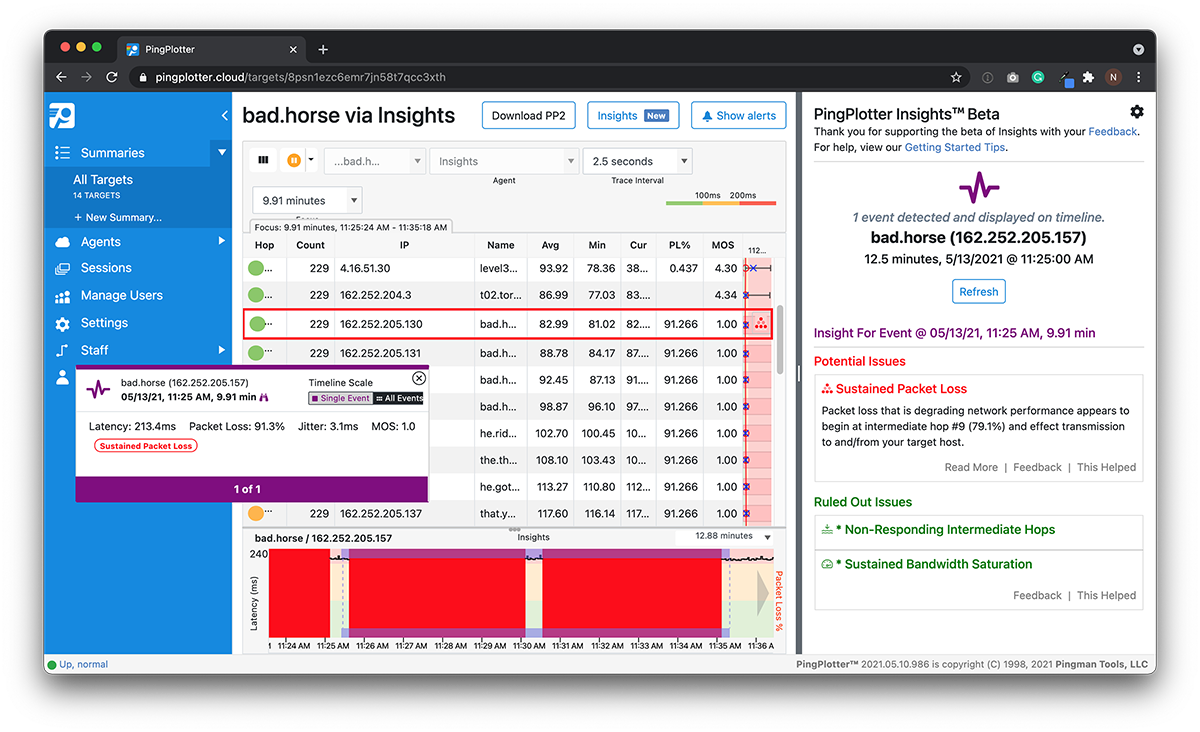
Insights will provide as much information as it can to help interpret the incident. In the current beta, Insights will highlight the offending hop (or hops) and share details on possible causes. Insights will also open a small info card with other relevant information, such as timestamps and network performance metrics, for the selected incident.
Once you’ve finished your analysis, you can click the Insights button again to return to the normal Target View.
Licensing
Can I buy a single license and use it on more than one computer?
Yes, a single license can be installed on a handful of machines. However, you’ll only be able to run a single instance of PingPlotter one at a time. For example, two machines with the same licensed version would work, just not simultaneously.
Do you have a concurrent use license?
Not at the moment. You have the option to install PingPlotter on a machine, then uninstall and reinstall on a different machine as you need it.
How is PingPlotter licensed?
Single Licenses
A single user license is good for one user (person), and can be installed on a computer, uninstalled and moved to another machine. It’s also able to be installed on more than one computer at a time, however, only one instance of PingPlotter will work at a time (not simultaneously).
Multi-computer licenses operate strictly by the number of computer installs.
How many licenses does my team need?
For Individuals
Single-user licenses are ideal for an individual IT person supporting an office or small client base. This license allows them to troubleshoot and monitor several targets.
For Teams
If a team of people need their own instance of PingPlotter, a single-user license for each person would suit them best. Allowing them to troubleshoot and monitor their own situation. If a team of people will be using the same computer (with their own user profile), then a license for each user is recommended. For teams of people needing access on several machines, multiple-computer licenses are for you. This scenario would allow several computers to all have their own independent functions with PingPlotter, troubleshooting and monitoring their own set of targets.
A license for each individual user profile (if they require separate configurations/targets/etc.). Or, if each user profile uses the exact same instance (same configurations/targets/etc.) a single license would work.
Configuring the Windows agent
Because the Windows agent is a full-fledged server unto itself, you may want to have it behave differently depending on where you’re installing it.
Server Port
The default server port of the Windows agent is 7465. If this doesn’t work for some reason in your network, you can change it by right-clicking on the tray icon and selecting the «Settings…» option. Clicking on the «Apply» button makes that change immediately, and if the server is unable to start on that port an error will occur.
Security
You might not want to expose the agent to anyone or limit access to it. This can be done via the username / password settings in both the agent and the remote trace setup in PingPlotter. The authentication system uses standard HTTP basic authentication. If the agent requires a username / password, and it doesn’t match what’s specified in PingPlotter, an error will show up in PingPlotter. If no username or password is required by the agent, then the username / password settings in PingPlotter will be ignored.
Gettin’ ping-y with it
First, let’s get one thing straight: Ping kicks ass.
Ping is lightweight and efficient — the mark of any great tool. It uses (by default) a dedicated type of packet called ICMP, which, unlike other packet types, isn’t used to transport traditional data. Instead, it carries error messages and other control information between devices to communicate things like redirects and domain name requests. Since ICMP packets are so small, they don’t eat up bandwidth and are quickly exchanged, making them a great vehicle for simple things like, say, figuring out how long it takes to send a chunk of data to and from a location.
Another great thing about ping is how it originates from the host, providing the correct perspective on your network condition. A lot of web-based tools try to diagnose issues from the outside in, which can be wildly inaccurate. Ping sends test packets from the source: your device. The data you see is accurate and actionable.
As helpful as it is, ping isn’t perfect; far from it. For starters, pinging a server can tell you a lot, but it falls short for identifying the location of any issues en route. Consider the data ping actually collects. When you send an ICMP echo request packet to an endpoint, you learn two things:
- Whether your packet made it to its destination (or the response made it back to you).
- How long it took.
That’s it.
While knowing latency and packet loss frequency is useful in identifying the existence of a problem, that’s all it does. Ping is like a firefighter who just tells you your house is on fire — important information, but not very helpful for, you know, making things not on fire.
Another issue is tied to ICMP packets themselves and how some devices and firewalls handle your pinging. There’s a lot to unpack with that, but here’s the short version: Some routers and firewalls turn down or ignore ping packets to keep evil ne’er-do-wells from breaking stuff. Is it the sort of pitchfork mob-inducing issue people make it out to be online? Nah. But it is a thing ping struggles with.
It’s these shortcomings that make ping-only tools a hard sell. However, there is another option that addresses many of ping’s issues…sort of.
Installing the UNIX Agent
The PingPlotter remote agent for UNIX is a Perl or PHP script that uses the UNIX traceroute command to gather sample set(s) and pass the results to PingPlotter via a web server. Because of all the various flavors of UNIX that exist, and the possible differences when it comes to the output of the traceroute command, you may need to modify the script for your particular source machine. We’ve primarily tested under FreeBSD and Debian. Contact us if you have problems here.
- Download the unix agent script from the agent download page.
- Extract the perl script (trace.pl) or php script (trace.php) into a web-accessible directory on a UNIX web server that is capable of serving the appropriate script.
- If necessary, set the script to be executable by your web server, (chmod 755, or similar, and don’t forget to check the permissions for the directory).
- Test it from a web browser to make sure it’s accessible. Example: http://www.yourwebserver.com/pp_pro_agent/trace.pl (or trace.php if you’re using the php version).
- Test a full trace from the web browser. This requires the ?IP= parameter (?ip=parameter will fail, the ‘IP’ needs to be capitalized). This would look like this to trace to 192.168.1.1: http://www.yourserver.com/pp_pro_agent/trace.pl?IP=192.168.1.1 Ideally you’ll want to use a valid IP address here, of course — one that works on the remote agent’s network.
- Verify the output. If it’s working, you should get output that looks something like this:
PingPlotter remote trace agent, V0.4
1 192.168.1.1 0.684 ms
You’ll probably have more hops than this. This is just an example if you were using an IP local to your server.
If you have an error, look at the source code for the script for some different alternatives and help.
Mac
PingPlotter for Mac downloads in a .zip file. After downloading and extracting the file, a prompt will come up asking if you want to move the program to the application folder (which we recommend doing). Once the file is extracted to the application folder (or any other location you may have chosen to keep it), it will automatically launch — and you’re all set from there.
Uninstalling
Uninstalling is a fairly straight forward process; simply move the application from wherever you’re keeping it (application folder, or elsewhere), and move it to the recycle bin. The program does store its configuration files and data in a separate location, though. To find these files, open a new Finder window, click on the «Go» option in the menu, and choose the «Go to Folder» option. From there, enter «~/Library/Application Support/PingPlotter» (minus the quotes) if running as an application, or «/Library/Application Support/PingPlotter» (without the quotes) if running as a service, which will direct you to the directory where PingPlotter stores all of its info (and you can move all of this to the recycle bin as well).
Comments
If you’re using PingPlotter for long-term monitoring, you may sometimes run across a situation where your network was effected by something you know about (power outage, big file download, that time you threw your router out the window, etc). You may also run into situations that you don’t control, but know the cause of (or can speculate on). Being able to take notes about these situations and tie it to your data can prove to be very, very helpful.
To create a note, all you need to do is right click on a timeline graph (at a point you want to create a note), and select the “Create Comment” option. A prompt will appear asking you to create your comment, and then PingPlotter will draw a red triangle on the lower edge of the timeline graph. If you float your mouse over the triangle you can see the note:
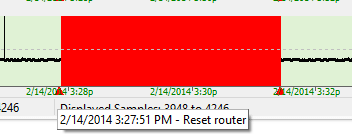
Right clicking on the comment triangle will also allow you to edit or delete it.
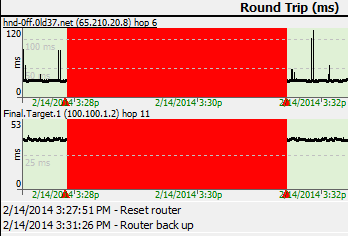
When you save data as an image from PingPlotter, your comments will get attached to the image (along with the times they happened). If you’re sending a image to a network provider, this can be especially valuable — as it helps explain the events on the data that you’re sending to them:
If there is more data collected than we can show on a timeline graph (for example, if you’ve got 48 hours worth of data, but have your graph scale set to “10 minutes”), you can click (and hold down) your mouse button on the graph, and drag it back and forth. This allows you to move back in history and examine the samples during those times.
On Windows, if you click on a graph and scroll down, you’ll move back on the time graph, scrolling up will move the graph forward. If you click the scroll wheel, scrolling up or down will toggle through the time period options on the graph (so you can basically zoom in, or zoom out using this method). On Mac, with a magic mouse you can hold a left click and scroll to zoom in/out on the timeline graph.
Installing the Windows Agent
The PingPlotter remote agent for Windows is a self-contained executable that includes a small server and some portions of the PingPlotter core trace engine. This agent can run as an application or as a service under Windows XP or newer.
Note: Presently the Windows agent does not come packaged with an installer or uninstaller.
- Download the Windows remote agent from the agent download page.
- Extract the agent (PingPlotter_Remote_Agent.exe) to a working directory (e.g., c:\Program Files\PingPlotter Remote Agent).
- Browse to the directory where you extracted the agent and launch it. The agent will show up in the system tray.
- Ensure your firewall(s) allow access to the agent on TCP port 7465, or change the server port for the agent. To change the port, as well as other settings for the agent, double-click on the tray icon.
- From your PingPlotter machine, launch your web browser and access the agent at http://(your agent machine name):7465.
- Verify the output. It should look something like this (in your browser):
PingPlotter Pro Remote Windows Agent V0.8.2.18
Tracing to:
Error: Must specify an IP Address
Continue on to the
The windows agent has a few options, to see about its use, see the section.
Windows Agent Revision History
Windows Agent, Latest release: 4.11.1.4, December 7th, 2015
This release is compatible with PingPlotter Pro version 3.10p and newer. The latest version is recommended, though, and has some reliability improvements when used with the remote agent.
Changes since 0.8.2.18
- Lots of engine changes, too many to list.
- IPv6 packet support.
- To use UDP packets, you’ll need a firewall rule set up. The easiest way to do this is to install PingPlotter 4.11.0 or newer on the agent machine, too.
- Version 4.11.1.3 had a bug when pinging final destination only. If you’re experiencing that, please download a 4.11.1.4
Release: 0.8.2.18, October 12th, 2007
Changes since 0.8.1.16
- Improved trace queuing which should improve performance.
- Fixed a problem where «StartingHop» parameter wasn’t always respected when configured to only ping the final destination. This is great if you want to ping a bunch of targets, rather than tracing them.
- Interhop delay wasn’t being respected.. Fixed.
- Added a basic status page to see the agent is up to. This is really for troubleshooting, but it can be accessed through http://localhost:7465/Status (if the agent is on localhost, that is — if it’s someplace else, change the address).
- Misc engine changes brought over from the Pro changes. Mostly minor with respect to the agent.
- Added a bunch of debugging code. Also added support for «simulation» (internal use only) to try and help troubleshoot problems.
Release: 0.8.1.16, April 25th, 2006
Changes since 0.8.0.51
- New Icon / Tray Icon
- New Exception handler to better trap errors. Errors are written to «bugreport.txt» at present, in your agent install directory.
- Maximum thread count can now be changed for better support for more concurrent targets.
- When capacity is reached, the agent now errors back to PingPlotter Pro with a 503 error, which tells PingPlotter Pro to try again shortly and not to count that request as a sample.
- Agent can now trace using UDP, ICMP Raw Sockets and TCP. These are enabled by adding ?PacketType=UDP, ?PacketType=ICMPRaw or ?PacketType=UDP to the URL in the PingPlotter named configuration.
Unix Agent, Latest release: 0.5, July 8th, 2014
If your current agent is working, there is no need to update.
Changes in V0.5 since V0.4
- Added support for PacketType and TCPPort parameters for php script only.
- perl script is still V0.4
Changes in V0.4 since V0.3
- Added php version of agent.
- Minor documentation changes.
Changes since V0.2
- Added a command line for RHEL 3, 4, Gentoo, several others.
- Changed check for no IP address passed in.
- Added link to documentation page.
Troubleshooting a remote network
Not every network problem impacts an endpoint you can readily access. When you need to test the active path between a device and a destination on a remote network, there are a few ways to get PingPlotter up and running.
Deploying a PingPlotter Cloud Agent
The easiest way to get remote network data is with PingPlotter’s Cloud remote monitoring tools. Cloud uses software-based agents to capture remote data and relay it back to you, giving you the critical perspective needed to find and fix a connection issue.
Deploying a Cloud Agent is as simple as generating and distributing a custom-generated hyperlink. With a few clicks, anyone can get PingPlotter ready to collect network data.
It’s that easy!
CloudConnect is now PingPlotter Cloud.
PingPlotter Cloud does everything CloudConnect does and a whole lot more. Learn more about the change and what it means for you.
Learn More
Deploying an entitled PingPlotter build
In some cases, it may make sense to get PingPlotter deployed remotely the same way you would deploy it locally. This option is great for solving one-off network problems on a device you can’t easily get to.
You can have someone at the remote device download the base PingPlotter installer and enter the appropriate credentials, but that’s a bit tedious. Instead, simply send them an installer with everything already filled out by downloading and sharing an entitled build from the account system.
Once the installation is done, simply tell them where to trace, and let PingPlotter do the rest.
After PingPlotter collects enough data, the remote user can use PingPlotter’s share functions to send what you need. We have a ton of sharing options built right into PingPlotter, so you should always have access to the specific data you need. You can learn more about sharing PingPlotter results here.
Deploying PingPlotter from a third-party package installer
Conveniently, you can get PingPlotter deployed through a number of third-party software package installers. Services like Chocolaty support installing PingPlotter using custom scripts or through more traditional app managers.
Simply follow the instructions of your favorite packager or app manager to download and install PingPlotter. Once PingPlotter is installed, the user on the other end can enter the appropriate credentials, and you’ll be set!
Essentials
What’s a good use case for PingPlotter Professional?
Collecting data for long periods of time and sometimes from other machines. Possibly from clients/customer machines. Using features to import data automatically. Scenarios where there is a need to test many targets at a time (up to several hundred).
Use Cases:
ISP’s, Telecom Companies, Gaming Companies, Government Offices, Tech Support Teams
What’s a good use case for PingPlotter Standard?
Collecting data over time with options to test more than one target (two at a time). Scenarios for performance based alerts and notifications. Share collected data to support staff, IT department(s) and/or ISP’s.
Use Cases:
Small/Medium sized businesses, Home users, Gamers, Independent Technicians/IT staff
What do I need to collect data for several clients/customers?
We recommend using PingPlotter Cloud for scenarios in which you are collecting data from multiple client/customer endpoints.
However, PingPlotter Professional can process data from multiple sources if needed.
Share
Users can use the Share function to submit collected data to someone (like their ISP or IT support staff). Allowing people to show network results by posting them on a private share page hosted on PingPlotter.com.
PingPlotter to PingPlotter
Additionally, anyone can collect data using the PingPlotter Free Edition. Then send .pp2 files to whomever they choose, so they can be opened on another instance of PingPlotter.
Learn more about PingPlotter’s Share features here.
Can I install PingPlotter on a server to be used by many other users?
Shared Server Environment
We don’t currently have a license built for a shared server environment. For example, a single instance of PingPlotter that can be accessible for many users all with different targets, configurations, etc.
Single License on a Server
We do however, allow you to install PingPlotter on a server. Only a single license is needed if each user is accessing the same instance of PingPlotter (same target list, configuration, etc.). If each user needs their own individual instance of PingPlotter, then each user needs their own license.
Only if PingPlotter is configured to one user profile and is a single instance that multiple users will access. If there are several user profiles that all require their own instance of PingPlotter (separate targets, configurations, etc.) then a server would be considered «multiple computers».
03-01-2021 — PingPlotter Version 5.19.1 Update
New Features
- Updated packet generator — PingPlotter’s packet generator has been updated to improve its accuracy for sub-millisecond latencies over long periods of persistent testing.
- Comments in the web UI — Just like in the platform, you can add comments to specific points in Timeline Graphs. You can also set alerts to automatically add comments under specific conditions.
- Agent-based summaries in the web UI — PingPlotter Cloud Agents are now given unique target summaries, making it easier to manage traces on remote devices. In addition, you can now create LiveShare links for Agent summaries, allowing viewers to see the complete status of their network connection.
Improvements
- Changed the Save Image alert to use a 24-hour time in file name instead of a 12-hour time
- Improved CloudConnect Agent install process to be less confusing when deploying to remote devices
- Special characters are now supported when naming an Agent through the web UI
- (Web UI) Made CloudConnect Agent management easier to navigate
- (Web UI) The target input history dropdown is now customizable and remembers previous entries
- (Web UI) Timeline Graph scrolling is much more smooth and logical
- (Web UI) Added an All LiveShare viewer page
- (Web UI) Added settings for latency color scale
- (Web UI) Updated control panel reactivity to work better on more screen sizes
- (Web UI) Improved the Trace Graph dropdown menu
- (Web UI) Improved resource usage and performance
How Does PingPlotter Cloud Work?
PingPlotter Cloud uses the latest Azure cloud technology to give commands, receive data, and display that data in a user-friendly way. This allows users to effectively monitor and troubleshoot network issues from anywhere in the world.
There are several parts of PingPlotter Cloud:
- The Interface is where you administer your PingPlotter Cloud subscription. The Interface gives a live overview of all of your Agents and targets they’re tracing to.
- The Cloud is an intermediary where the data is gathered from the Agent and presented in the Interface.
- Agents are remote PingPlotter instances that collect data and report information back to the Cloud. They run within the networks you wish to monitor or troubleshoot.
- A trace (or traceroute) using PingPlotter Cloud is just the same as a trace normally initiated by the PingPlotter desktop application.
- A target is an IP address, URL, or DNS hostname corresponding to a destination device.
Agents use a combination of ping and traceroute to collect network data like latency, packet loss, and jitter. This data is then relayed to PingPlotter Cloud and displayed so that your team can diagnose network issues from the remote device’s perspective using a web browser.
What is Pingman?
Pingman Tools is the developer behind PingPlotter Cloud and a number of other innovative software solutions (horn toot). All of our software licenses and billing is managed through a Pingman Tools account.
What to look for
There are many issues that could be affecting your Teams call quality. Here are some of the most common:
Device completely «down»
This result would show a bunch of solid red bars from the beginning of the route to the end. It can also start a “hop” or two down the line.
What do I do if I see this?
- If it’s starting at the very beginning of the trace, try giving your router a reboot.
- If that doesn’t help, and the pattern persists after you’ve given it a reboot, you may need to look into a replacement router.
- If the red is starting a hop or two down, contact your ISP.
WiFi interference
With this, we’ll see some red beginning at the start of the route similar to what we saw with a device being down, but more sporadic. This is normally caused by poor WiFi access point placement or by too many networks broadcasting nearby (apartment complexes are notorious for this).
What do I do if I see this?
- You can try a router or WiFi access point reboot right off the bat.
- Switch to a different wireless band. Most WiFi access points these days have dual-band; try to hop onto the other band temporarily.
- If the above isn’t possible, you may want to look at where you put your router or WiFi access point. Make sure that it is away from metal (including electrical conduit), and is away from televisions, microwaves, and Bluetooth devices like speakers.
- You may be experiencing saturation on your current WiFi channel. You can research the model of router or WiFi access point you have, and search for “channels”. You might want to set the device to switch channels automatically or search for a channel that isn’t being overused by nearby networks.
- If that doesn’t shape it up, you can acquire an Ethernet cable and plug your computer directly into your router. We always recommend a wired connection over a wireless one.
Bandwidth saturation
Normally, the pattern that indicates that you’re overusing your bandwidth would look like the above: an almost sawtooth-like pattern, which may or may not have a clear start and stop point.
What do I do if I see this?
- Check for bandwidth to see right away if you have too little bandwidth or are using too much of what you have.
- Use less bandwidth by limiting your demand on your connection. Close down music streaming, video streaming, and so forth.
- Throttle your network. This one’s a bit harder. Search for the model of router you have, and add terms like “rate limiting” or “bandwidth limiting”. That should get you to an explanation of how to throttle back the traffic a bit.
- If this continues to be an issue, you may need to contact your ISP and ask if you have a higher bandwidth tier available to you.
What to target
For conferences, Microsoft uses a server of theirs, which is chosen based on proximity to the conference creator, as a relay. Other communications may use peer-to-peer connections for things like calls between two people, meaning that the data is going straight from you to your colleague without hitting an intermediary server.
Microsoft has a list of servers and their IP addresses used for Office 365 services. The cool thing is that they’re using DNS — you don’t necessarily need to look through giant lists of IP addresses. Simply trace to a DNS address, and it should resolve to a viable server.
You can click on the link below to automatically launch a PingPlotter trace to an Office 365 server used for Teams (if the link does not open PingPlotter, you can also enter the IP address of the server into PingPlotter’s Target Bar).
Microsoft Teams server: teams.microsoft.com
Version 5 Manual
Timeline Graphs
Network problems can often happen when you’re not watching for them. The timeline graph feature in PingPlotter gives us a quick way to look over a visual representation of our trace data. This makes spotting problems (or potential problems) much, much easier.
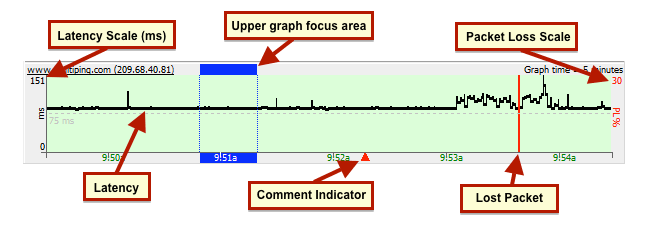
By default, PingPlotter will automatically trace the last hop (the host you’re tracing to) on a timeline graph.
In PingPlotter Standard and Pro you can also display a timeline graph for any of the other hops in a route by either double clicking on that hop, or right clicking and selecting “Show this timeline graph.” You can also turn off any graph by these same mechanisms.
The amount of data displayed on the graph can be changed, too — just right click anywhere on the graph and select the amount of time you’d like to display (this will affect all timeline graphs and is saved when you shut down PingPlotter).
Loading a list of targets
If you’ve got a list of IP addresses, DNS names, or both, you can “bulk add” them into PingPlotter Pro as well. You’ll want to make sure your list is formatted correctly to accomplish this. In a text editor (notepad works just fine here) create a list of your addresses — one target per line. Once you’ve got everything added in, save the file with a “*.lst” extension.
Once you’ve got your list saved, in PingPlotter go to «File” -> «Load Target List File,» navigate to your list file and open it — and PingPlotter will load up the targets from the list.
Voila! PingPlotter will start to load your list of targets, one at a time — exactly as though each target was entered into the “New Target” field. Any invalid targets will prompt an error — which will prompt *after* PingPlotter gets through your entire list.